THE ADVOCATE 843
VOL. 79 PART 6 NOVEMBER 2021
In sum, apart from length of hearings, all metrics increased significantly
between 1970 and 2015 at the B.C. Court of Appeal.
Supreme Court of Canada
As a way of viewing the performance of the B.C. courts in a comparative
light, the same data points were collected from the Supreme Court of
Canada. Although that court has a much smaller and more specialized
workload than either the B.C. Supreme Court or the Court of Appeal, and
controls most of its own docket through the leave process, it is still instructive
to consider its performance.
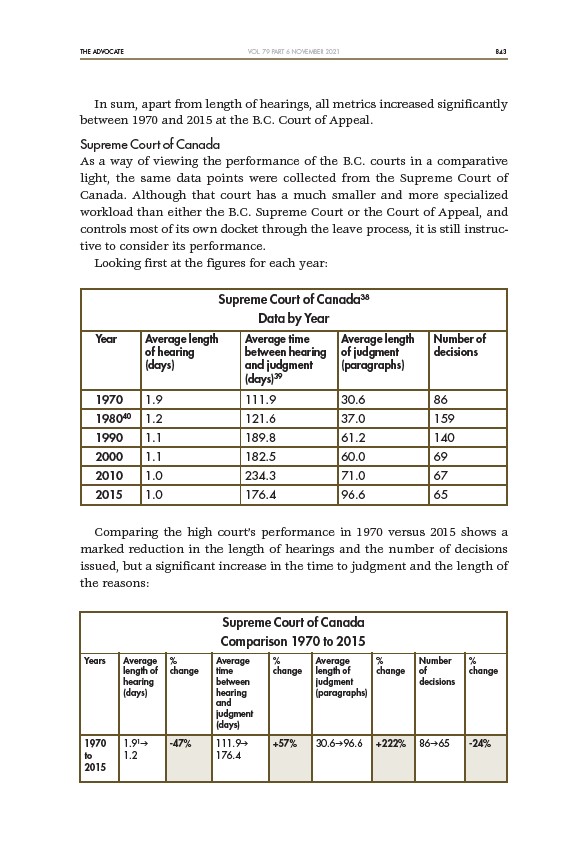
Looking first at the figures for each year:
Supreme Court of Canada38
Data by Year
Year Average length Average time Average length Number of
of hearing between hearing of judgment decisions
(days) and judgment (paragraphs)
(days)39
1970 1.9 111.9 30.6 86
198040 1.2 121.6 37.0 159
1990 1.1 189.8 61.2 140
2000 1.1 182.5 60.0 69
2010 1.0 234.3 71.0 67
2015 1.0 176.4 96.6 65
Comparing the high court’s performance in 1970 versus 2015 shows a
marked reduction in the length of hearings and the number of decisions
issued, but a significant increase in the time to judgment and the length of
the reasons:
Supreme Court of Canada
Comparison 1970 to 2015
Years Average % Average % Average % Number %
length of change time change length of change of change
hearing between judgment decisions
(days) hearing (paragraphs)
and
judgment
(days)
1970 1.91g -47% 111.9g +57% 30.6g96.6 +222% 86g65 -24%
to 1.2 176.4
2015