THE ADVOCATE 839
VOL. 79 PART 6 NOVEMBER 2021
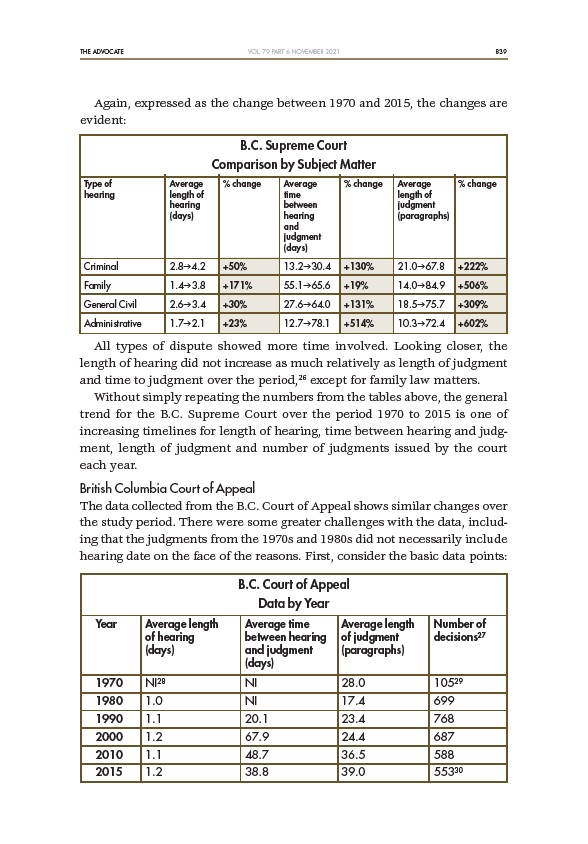
Again, expressed as the change between 1970 and 2015, the changes are
evident:
B.C. Supreme Court
Comparison by Subject Matter
Type of Average % change Average % change Average % change
hearing length of time length of
hearing between judgment
(days) hearing (paragraphs)
and
judgment
(days)
Criminal 2.8g4.2 +50% 13.2g30.4 +130% 21.0g67.8 +222%
Family 1.4g3.8 +171% 55.1g65.6 +19% 14.0g84.9 +506%
General Civil 2.6g3.4 +30% 27.6g64.0 +131% 18.5g75.7 +309%
Administrative 1.7g2.1 +23% 12.7g78.1 +514% 10.3g72.4 +602%
All types of dispute showed more time involved. Looking closer, the
length of hearing did not increase as much relatively as length of judgment
and time to judgment over the period,26 except for family law matters.
Without simply repeating the numbers from the tables above, the general
trend for the B.C. Supreme Court over the period 1970 to 2015 is one of
increasing timelines for length of hearing, time between hearing and judgment,
length of judgment and number of judgments issued by the court
each year.
British Columbia Court of Appeal
The data collected from the B.C. Court of Appeal shows similar changes over
the study period. There were some greater challenges with the data, including
that the judgments from the 1970s and 1980s did not necessarily include
hearing date on the face of the reasons. First, consider the basic data points:
B.C. Court of Appeal
Data by Year
Year Average length Average time Average length Number of
of hearing between hearing of judgment decisions27
(days) and judgment (paragraphs)
(days)
1970 NI28 NI 28.0 10529
1980 1.0 NI 17.4 699
1990 1.1 20.1 23.4 768
2000 1.2 67.9 24.4 687
2010 1.1 48.7 36.5 588
2015 1.2 38.8 39.0 55330