836 THE ADVOCATE
VOL. 79 PART 6 NOVEMBER 2021
As the visual presentation should make clear, the greatest change has
come in the length of reasons, but hearings and the time needed to issue
decisions have also gone up. To better understand and assess the import of
the findings, as well as their limitations, it is helpful to look at each of the
courts separately and break the numbers down further.
British Columbia Supreme Court
By reason of its role as the court of first instance, the trial court necessarily
generated more decisions than the appellate courts. Over the study period,
the length of hearing increased, as did the time between hearing and the
issuance of reasons. The B.C. Supreme Court also produced more decisions
each year.
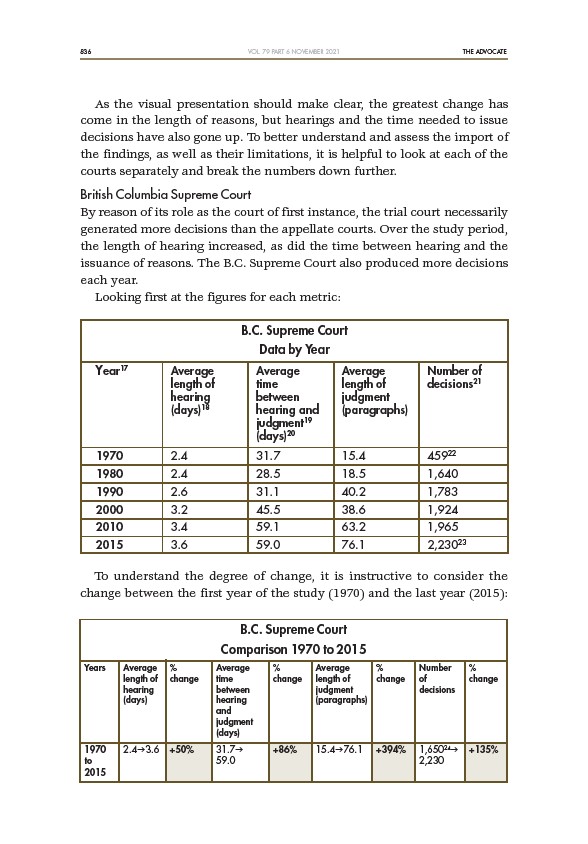
Looking first at the figures for each metric:
B.C. Supreme Court
Data by Year
Year17 Average Average Average Number of
length of time length of decisions21
hearing between judgment
(days)18 hearing and (paragraphs)
judgment19
(days)20
1970 2.4 31.7 15.4 45922
1980 2.4 28.5 18.5 1,640
1990 2.6 31.1 40.2 1,783
2000 3.2 45.5 38.6 1,924
2010 3.4 59.1 63.2 1,965
2015 3.6 59.0 76.1 2,23023
To understand the degree of change, it is instructive to consider the
change between the first year of the study (1970) and the last year (2015):
B.C. Supreme Court
Comparison 1970 to 2015
Years Average % Average % Average % Number %
length of change time change length of change of change
hearing between judgment decisions
(days) hearing (paragraphs)
and
judgment
(days)
1970 2.4g3.6 +50% 31.7g +86% 15.4g76.1 +394% 1,65024g +135%
to 59.0 2,230
2015