840 THE ADVOCATE
VOL. 79 PART 6 NOVEMBER 2021
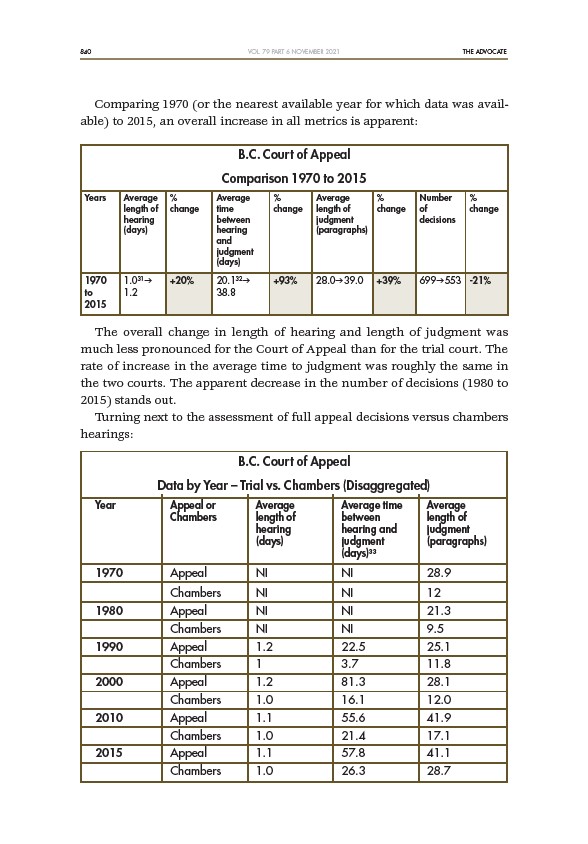
Comparing 1970 (or the nearest available year for which data was available)
to 2015, an overall increase in all metrics is apparent:
B.C. Court of Appeal
Comparison 1970 to 2015
Years Average % Average % Average % Number %
length of change time change length of change of change
hearing between judgment decisions
(days) hearing (paragraphs)
and
judgment
(days)
1970 1.031g +20% 20.132g +93% 28.0g39.0 +39% 699g553 -21%
to 1.2 38.8
2015
The overall change in length of hearing and length of judgment was
much less pronounced for the Court of Appeal than for the trial court. The
rate of increase in the average time to judgment was roughly the same in
the two courts. The apparent decrease in the number of decisions (1980 to
2015) stands out.
Turning next to the assessment of full appeal decisions versus chambers
hearings:
B.C. Court of Appeal
Data by Year – Trial vs. Chambers (Disaggregated)
Year Appeal or Average Average time Average
Chambers length of between length of
hearing hearing and judgment
(days) judgment (paragraphs)
(days)33
1970 Appeal NI NI 28.9
Chambers NI NI 12
1980 Appeal NI NI 21.3
Chambers NI NI 9.5
1990 Appeal 1.2 22.5 25.1
Chambers 1 3.7 11.8
2000 Appeal 1.2 81.3 28.1
Chambers 1.0 16.1 12.0
2010 Appeal 1.1 55.6 41.9
Chambers 1.0 21.4 17.1
2015 Appeal 1.1 57.8 41.1
Chambers 1.0 26.3 28.7